
The Double Dynamic RSX binary options strategy is based on the principle of following the trend , for which a special MarketStrength oscillator has been added to the system. To succeed in binary options trading using this free system, it is recommended to open trades only in the direction indicated by MarketStrength. Otherwise, you can run into a series of losing trades. Read our review to find out how to set up indicators correctly and what rules to follow to increase the percentage of profitable trades.
Content:
- Characteristics
- Installation
- Overview and settings
- Trading Rules for Double Dynamic RSX
- Specifics of application
- Conclusion
- Download Double Dynamic RSX
Characteristics of the Double Dynamic RSX Binary Options Strategy
- Terminal: MetaTrader 4
- Timeframe: M5
- Expiration: 3 candles
- Option Types: Call/Put
- Indicators: Double Dynamic RSX.ex4, MarketStrength.ex4, #P4L CandleTime .ex4
- Libraries: dynamicZone.dll
- Trading instruments: currency pairs , commodities, cryptocurrencies , stocks
- Trading hours: 8:00 - 21:00 Moscow time
- Recommended brokers: Quotex , Pocket Option , Alpari , Binarium
Setting Up a Strategy for Binary Options Double Dynamic RSX
The Double Dynamic RSX strategy indicators are installed in the Metatrader 4 platform as standard. To do this, you need to add them to the root folder of the terminal by selecting “File” in MT4 and then “Open data directory”. In the opened directory, you need to go to the “MQL4” folder and then to “Indicators”, then move all the files there. Templates are installed in the same way, but are placed in the “templates” folder. You can read the installation instructions in more detail in our video:
Attention! Do not forget to add the dynamicZone.dll library file to the "Libraries" folder of the MQL4 directory. Without it, the main indicator of the Double Dynamic RSX.ex4 strategy will not work.
Review and Settings of the Strategy for Binary Options Double Dynamic RSX
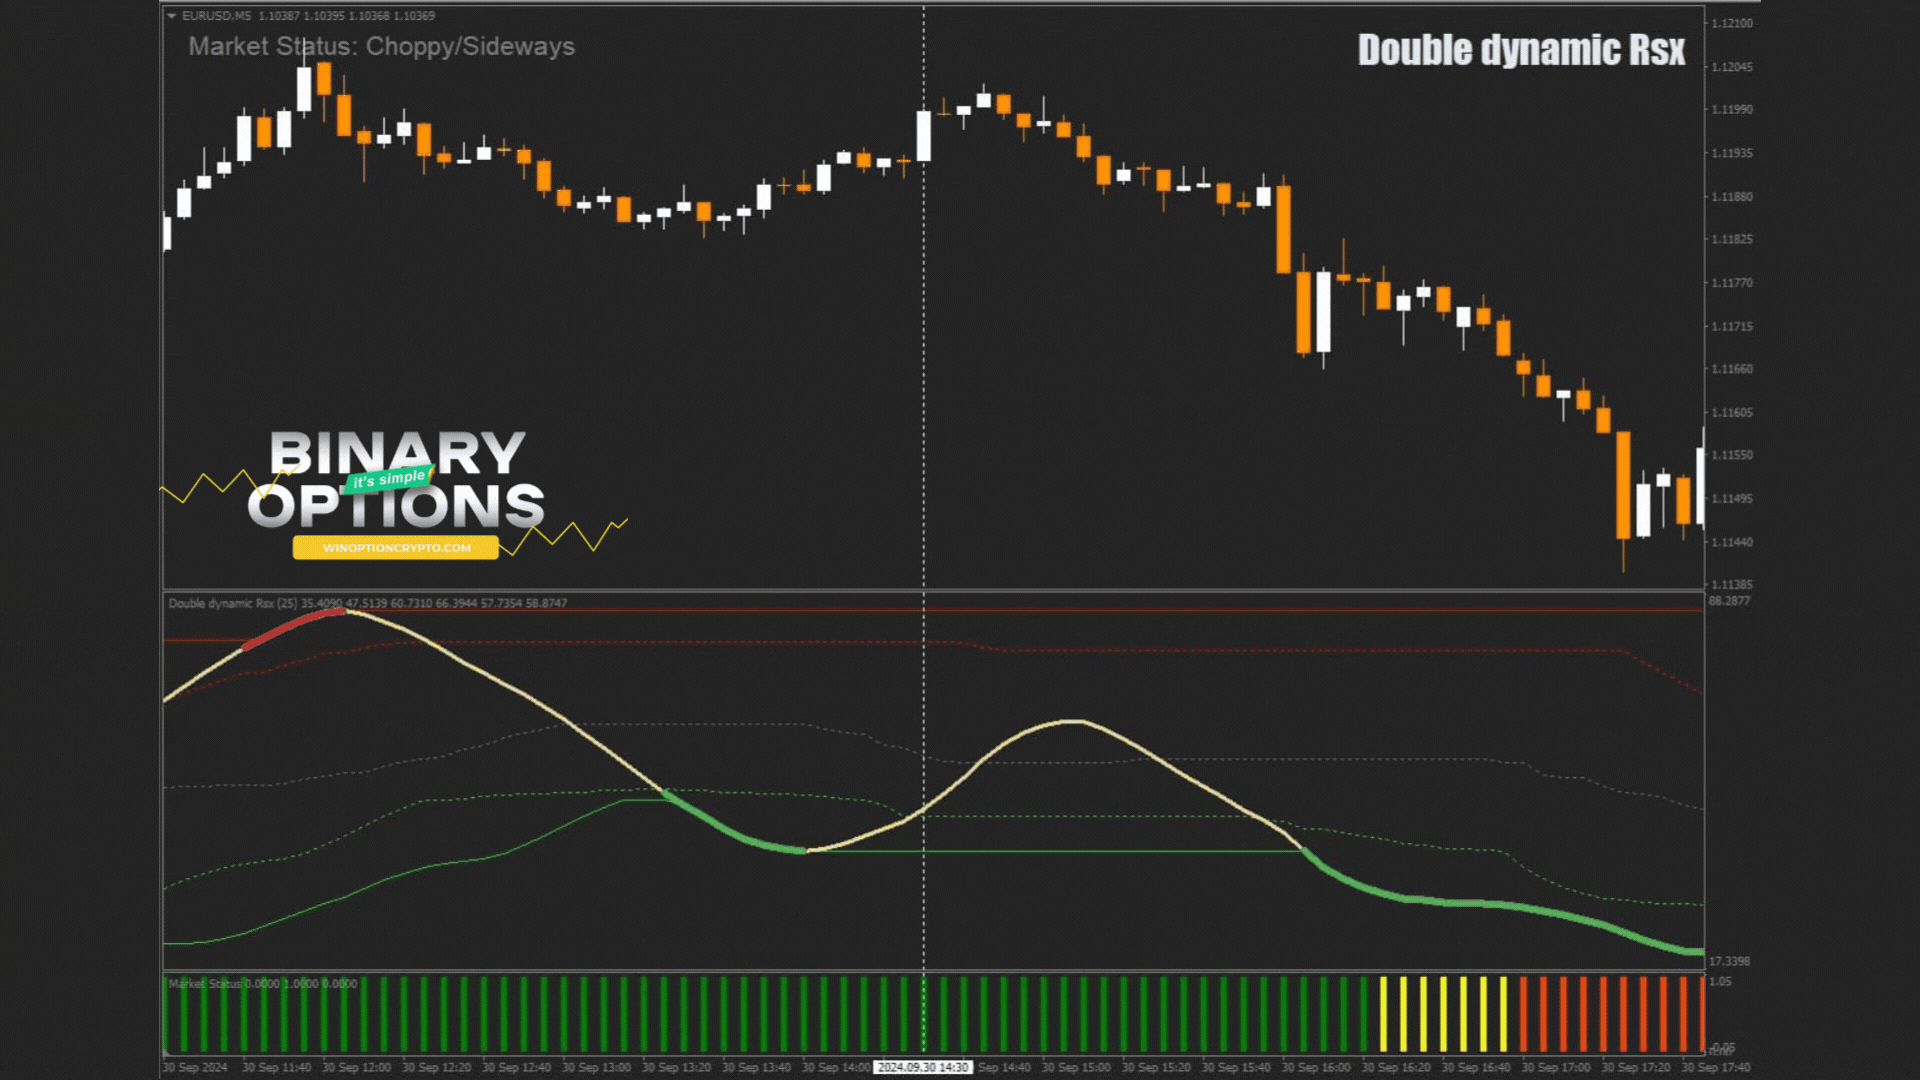
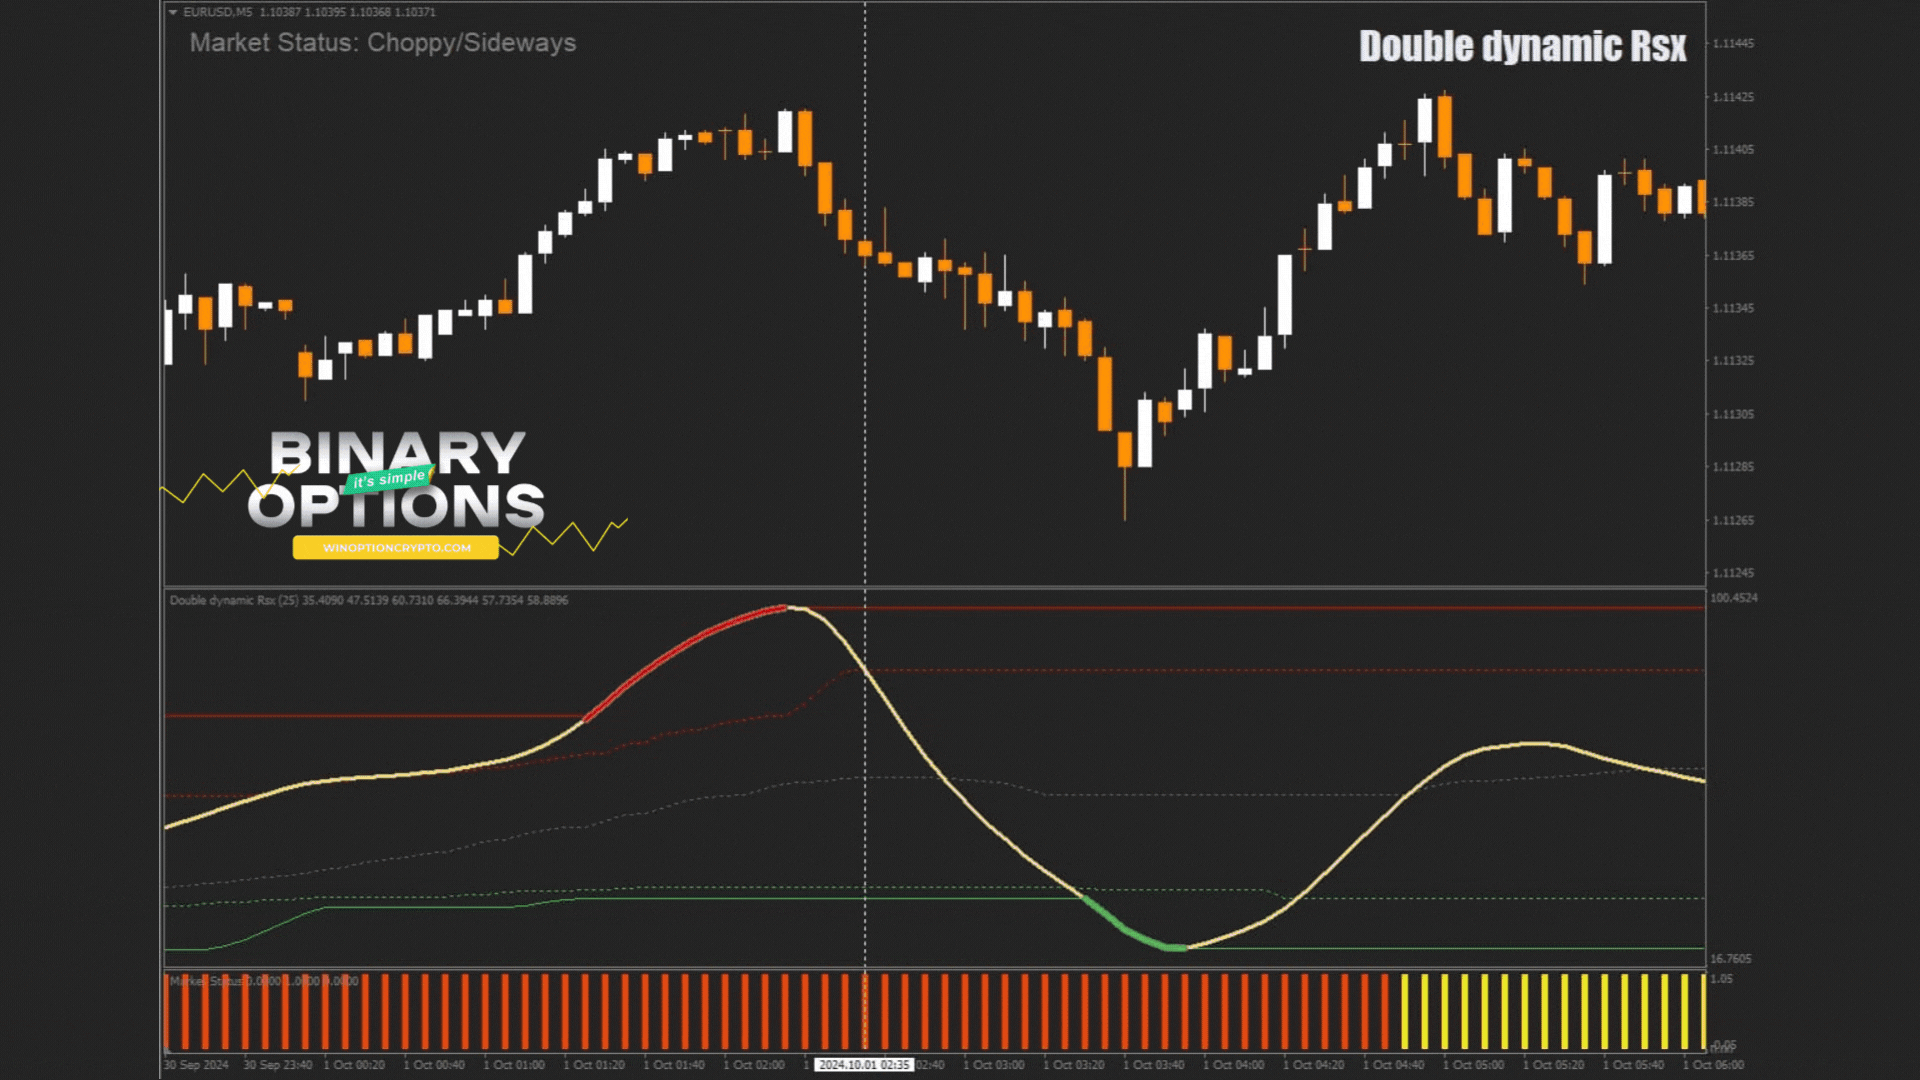
The Double Dynamic RSX binary options strategy consists of three custom indicators, each of which has a special role in this system. Double Dynamic RSX is designed to generate trading signals , while MarketStrength and #P4L CandleTime play a supporting role. The first acts as a trend filter, and the second counts down the time until the candle closes, which is very convenient when planning transactions.
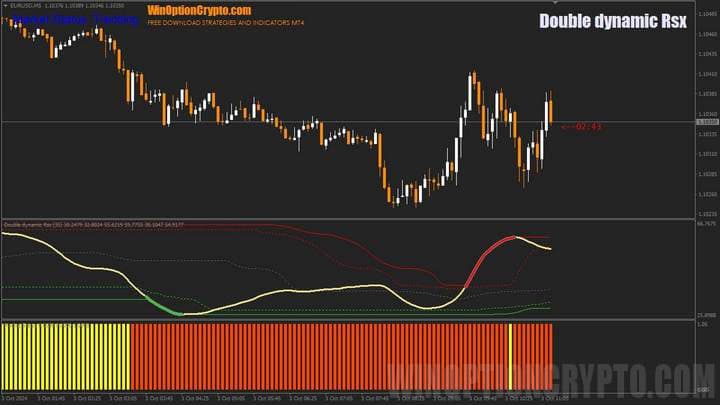
In this case, the "basement" oscillator Double Dynamic RSX generates a signal to buy Call when the yellow line crosses the lower dynamic level indicator from bottom to top, marked with a green dotted line, and a Put purchase is possible when the main yellow line crosses the upper red dotted level from top to bottom.
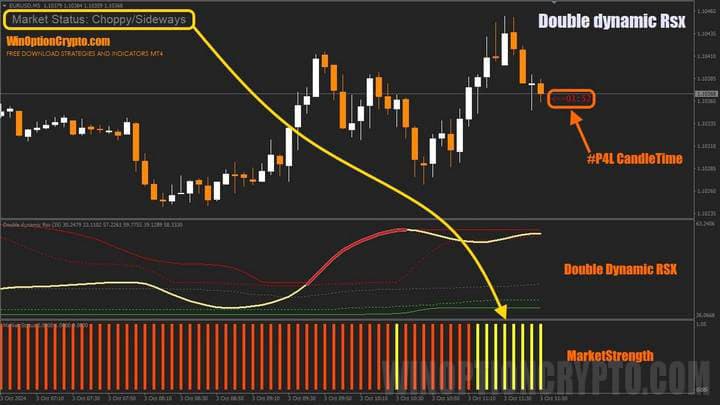
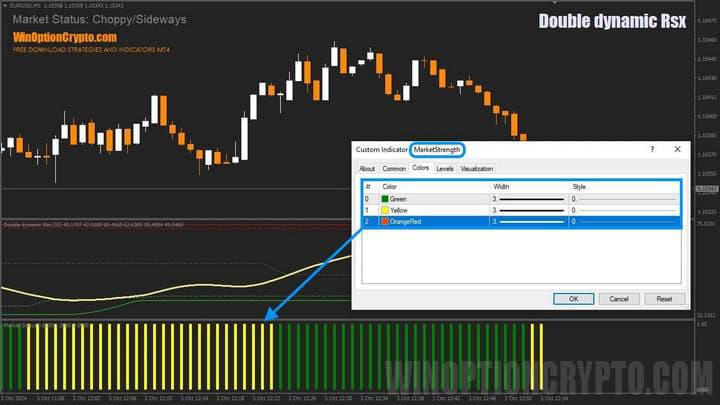
However, all Double Dynamic RSX signals in this trading system are filtered by the MarketStrength indicator, designed to assess the strength and direction of the current trend. This indicator informs about the direction of the market movement using a service message in the upper left corner of the chart.
It can have two statuses: Choppy/Sideways and Trending, which means flat and trend. As you might guess, it is better to avoid flat areas of the market and trade binary options only when the asset price moves up or down. Attempts to trade in a flat usually lead to loss of capital. You should not make this mistake, which is quite common among novice traders.
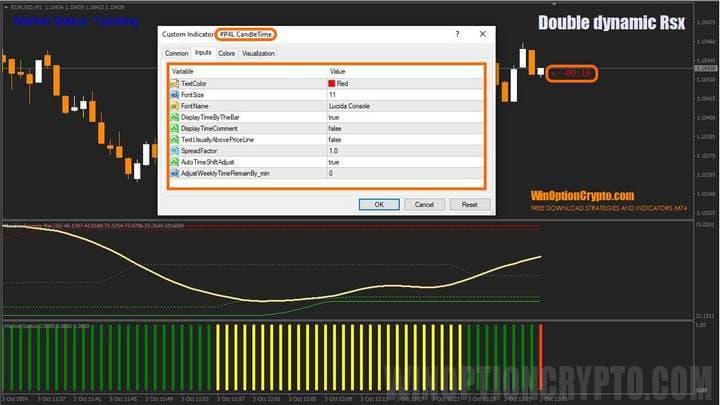
Now it's time to talk about the settings. In the #P4L CandleTime settings, you can set the font size, color, and time zone correction.
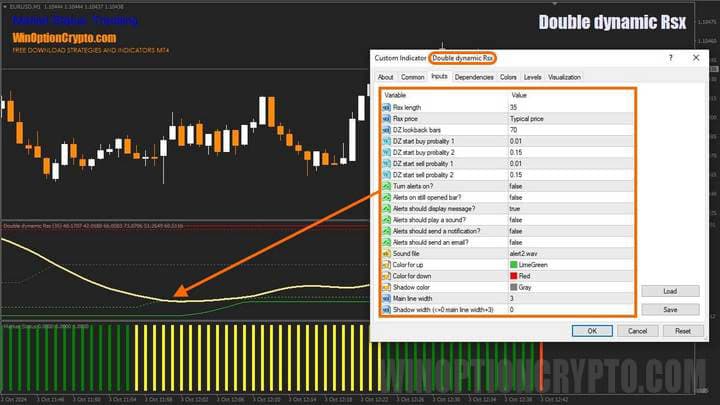
The parameters of the Double Dynamic RSX indicator set the calculation period of the signal line and auxiliary levels, the appearance, and the activation of pop-up messages (alerts) that promptly inform about potential transactions.
The last indicator of this system – MarketStrength – has the simplest settings. In fact, they are non-existent: the developer has completely hidden them, leaving the user with the ability to only change the color of the histogram bars indicating bullish, bearish trends and flat.
Trading Rules for Double Dynamic RSX
It's time to learn how to apply this trading system in real trading. But first of all, you should understand what a trend is and how to correctly identify it on the market. After all, not only the result of trading using this method, but also the results of binary options trading in general will depend on this skill. Therefore, we suggest that you familiarize yourself with a special selection of articles on this topic:
- How does a trend work in the markets?
- Identifying and using bullish and bearish trends.
- Market phase changes .
- How to identify a flat market?
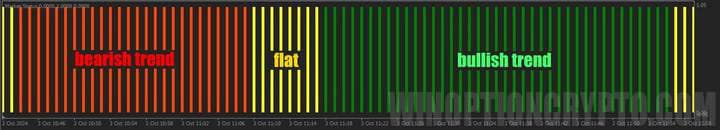
Before you start searching for trading signals for the Double Dynamic RSX binary options strategy, you need to determine the current trend on the market. Its direction will be indicated by the bars of the MarketStrength indicator histogram. If the histogram is green, the market is bullish; red - bearish, yellow - flat. That is why we start searching for signals with it.
After we have determined the trend direction, we need to wait for the intersection of the yellow signal line of the Double Dynamic RSX indicator with one of the auxiliary levels marked with a dotted line: green is the oversold zone, and red is the overbought zone.
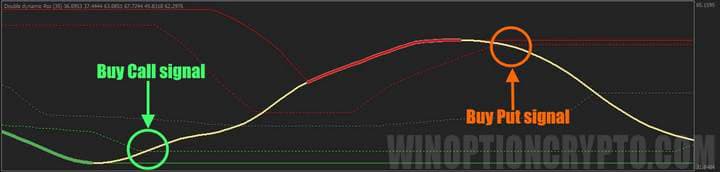
In the oversold zone, we will buy Call options, and in the overbought zone, Put options. And we do this only when the direction of the transaction coincides with the current trend: for Call, the MarketStrength histogram is green, and for Put, it is red.
Opening a Call Option
- We are convinced that the trend is upward – the MarketStrength histogram is green
- Double Dynamic RSX indicator is in the oversold zone and crosses the auxiliary level from the bottom up
- At the opening of the next candle we buy Call
Opening a Put Option
- We are convinced that the trend is downward – the MarketStrength histogram is red
- The Double Dynamic RSX indicator is in the overbought zone and crosses the auxiliary level from top to bottom
- At the opening of the next candle we buy Put
It is recommended to select the expiration time of 3 candles. Select the holding period of positions depending on the financial instrument and the results of testing on historical data.
Specifics of Using the Double Dynamic RSX Binary Options Strategy
The Double Dynamic RSX binary options strategy generates infrequent but high-quality trading signals. If for some reason the MarketStrength trend filter is not suitable for your asset, and this is possible given the hidden parameters of its settings, we recommend using one of the indicators described in the article “ The Best Binary Options Trend Indicators ”.
Pros of the Double Dynamic RSX Strategy
The advantages of this system include the absence of redrawing of its signals , as well as simplicity and accessibility for beginner binary options traders. The strategy has a component that can be easily replaced in case of poor compatibility with a certain asset. In the " Indicators " section of our website, you will find many alternative tools for determining the trend if MarketStrength for some reason does not suit you.
Cons of the Double Dynamic RSX Strategy
Among the disadvantages of the system, we note the small number of transactions that it generates. To compensate for this drawback, a trader can simultaneously monitor a large number of assets, and the presence of alerts in the Double Dynamic RSX indicator will not allow you to miss a potentially profitable transaction.
Trading on M1 may require additional adjustment of the signal indicator parameters, as well as revision of the trading rules. For lower timeframes, it is recommended to open trades without waiting for the yellow main line of the indicator to cross the auxiliary levels, and immediately open positions after the main line changes color from green to yellow in the oversold zone for Call and from red to yellow in the overbought zone for Put.
Conclusion
The Double Dynamic RSX binary options strategy is characterized by fairly high-quality, but rare transactions. This disadvantage can be compensated for by a larger number of assets that the trader monitors. At the same time, we emphasize the importance of following the trend, for which this trading system includes the MarketStrength indicator, which informs about its direction using special messages in the upper left corner of the chart.
This free strategy is universal and can be used in trading any currency pairs, indices, stocks or cryptocurrency. The only condition is the presence of volatility necessary for the formation of trend price movements. Before using it in real trading, we recommend testing it on a demo account opened with a reliable broker . Open trades, observing the rules of risk and capital management. We wish everyone a favorable trend!
Download Double Dynamic RSX

To leave a comment, you must register or log in to your account.