
The Binguru binary options strategy is another successful example of combining dynamic channels based on the popular Bollinger Bands indicator and the Quantum arrow indicator without signal redrawing. Despite their widespread popularity, both tools have their own unique characteristics that are important to consider for successful binary options trading. This review will explain how to most effectively combine these indicators.
Content:
- Characteristics
- Installation
- Overview and settings
- Binguru Trading Rules
- Specifics of application
- Conclusion
- Download
Characteristics of a Binary Options Strategy
- Terminal: MetaTrader 4
- Timeframe: M1
- Expiration: 3 candles
- Option Types: Call/Put
- Built-in indicators: Binguru-Quantum.ex4, Bollinger Bands.ex4
- Trading instruments: currency pairs, commodities, cryptocurrencies, stocks
- Trading hours: 8:00 - 20:00 (GMT+2)
- Recommended brokers: Quotex, Pocket Option, Alpari, Binarium
Setting Up a Strategy for Binary Options
You can download the indicators for this strategy from our website and install them in your MetaTrader 4 terminal using the standard method. First, open the terminal and select "File" → "Open Data Folder" from the top menu. In the window that appears, navigate to the MQL4 → Indicators folder and copy all the indicator files there.
If the package contains templates, they need to be moved to the templates folder in the root directory of the terminal.
After this, restart the platform for the new indicators and templates to appear in the list. For more detailed instructions, watch our video:
Binary Options Strategy Overview and Settings
The Binguru binary options strategy is based on Bollinger Bands, a popular technical indicator created by American trader and financial analyst John Bollinger. The distinctive feature of this tool, which has made it so beloved by traders worldwide, is its ability to not only indicate trend direction but also measure its volatility. 
It was John Bollinger who proposed combining a simple moving average with the statistical indicator of standard deviation, resulting in a dynamic channel that can expand during periods of high market activity and, conversely, narrow during periods of calm.
Bollinger is a Chartered Financial Analyst (CFA) and a Certified Technical Analyst (CMT). He is a frequent guest on financial television and the author of the bestselling book "Bollinger on Bollinger Bands," which has become a must-read for traders.
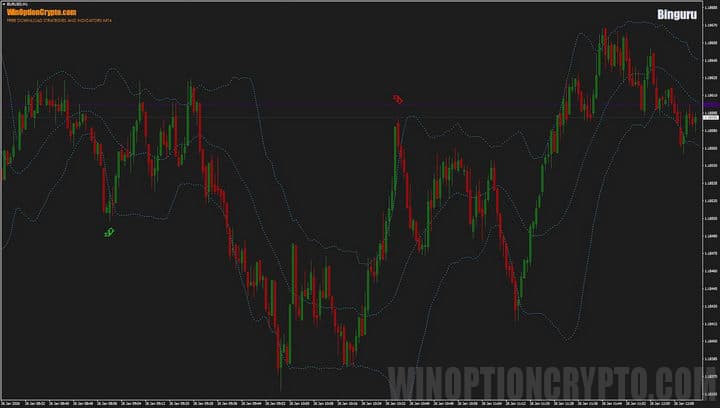
So what are these "magic" Bollinger Bands and how are they used in this strategy? It's simple: they act as a filter for the Quantum arrow indicator's trading signals. A trading signal in the form of an arrow should form outside the Bollinger Bands' boundaries, provided the signal's direction matches the close of the candle on which it appears.
![]()
As you can see in the image above, the signal on the left fully complies with all the strategy rules: the candlestick on which the arrow appeared closed outside the Bollinger Bands and in the direction indicated by the arrow—up. At this point, a call option should be purchased. The situation on the right is similar, but with one exception: the candlestick closed against the direction indicated by the arrow, resulting in a market move against the signal.
This simple method allows you to filter trading signals from an arrow indicator and increase the percentage of profitable trades. Considering that Bollinger Bands reflect levels two standard deviations away from the mean, a trader significantly increases the likelihood of a positive trade outcome by opening a trade outside these boundaries. An additional advantage is that the bands adapt well to market conditions, and their width depends on the current price spread relative to the mean.
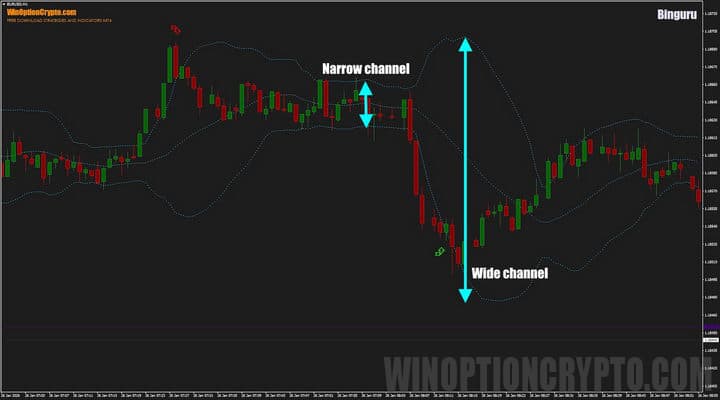
For example, during periods of high market activity, the standard deviation increases and the bands widen. Conversely, when the market is calm, the standard deviation decreases and the bands narrow.
Typically, signals from this system appear during periods of sharp band widening, indicating a significant price deviation from its average values. During such periods, it makes sense to consider trades in the direction of this movement.
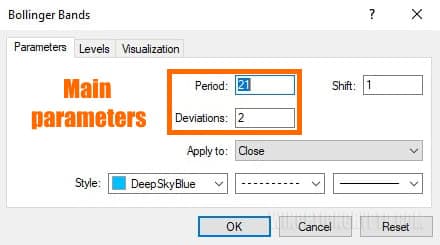
The trading system settings are extremely simple. For the Bollinger Bands indicator, set the calculation period to 21 and the deviation value to 2.
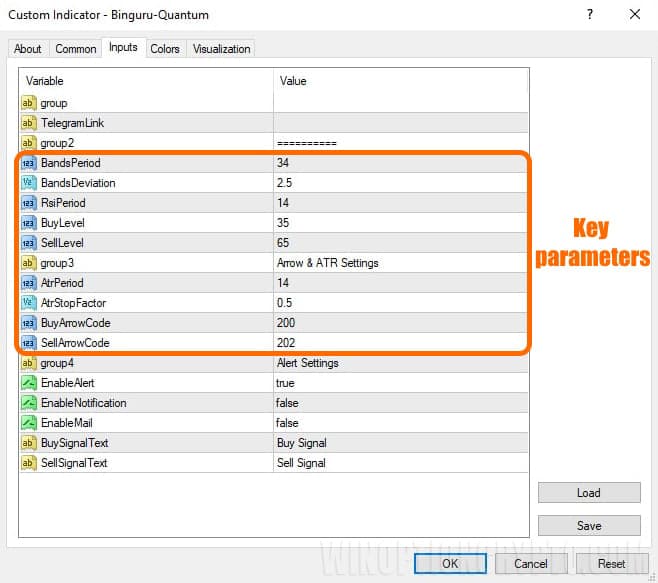
The signal arrow indicator has more settings and the main ones are marked in the image below.
If you'd like to learn more about signal indicators and how to use them correctly in binary options trading, check out our collection of articles on this topic:
Our website contains a wealth of useful materials that will help you better understand technical techniques and improve your skills.
Binguru Trading Rules
To increase the number of profitable trades using this system, you should follow simple rules: open positions when the price deviates toward one of the Bollinger Bands, and the candle with the arrow signal closes in the direction indicated by the arrow.
Opening a Call Option
- Make sure the price is outside the Bollinger Bands
- Wait for a green arrow to appear under the candle.
- Make sure the candle closes in the direction of the arrow.
- At the opening of the next candle, open a Call option
Opening a Put Option
- Make sure the price is outside the Bollinger Bands
- Wait for the red arrow to appear above the candle.
- Make sure the candle closes in the direction of the arrow.
- At the opening of the next candle, open a Put option
We recommend setting the expiration time to three candles. However, the optimal holding period depends on the specific asset and should be determined by you based on historical data testing results. This approach will help tailor the strategy to the specifics of the chosen instrument and improve its effectiveness.
Specifics of Application
The strategies published on our website typically recommend using trending assets. For most trading systems, this is indeed the best approach. However, the methodology described in this review also allows trades to be made during flat periods. In this case, call options are opened when the price approaches the lower Bollinger Band, and put options are opened when the price approaches the upper band.
Advantages of the Strategy
The main advantage of this system is its use of dynamic Bollinger Bands, which, unlike static channels, automatically adapt to market volatility, expanding in active markets and contracting in flat ones. Unlike the TMA indicator, these bands do not redraw their values, allowing binary options traders to objectively test strategies on historical data and trust the signals generated in real time. Furthermore, the system's signals are easy to read and do not allow for ambiguous interpretations, making it accessible even to beginners.
Disadvantages of the Strategy
The disadvantages of this trading method include the relatively small number of trading signals generated by the Quantum arrow indicator. Furthermore, it's important to note that Bollinger Bands is a lagging indicator: its bands always follow the price rather than predict it.
Conclusion
The Binguru binary options strategy is a trading approach based on signals from the Quantum arrow indicator, filtered using Bollinger Bands, and a simple candlestick closing rule. Dynamic bands allow the system to be used in different market phases, and the absence of repainting allows traders to trust trading signals generated in real time.
However, before using this system in real binary options trading, we recommend testing it on a demo account with a reliable broker. Remember risk and capital management rules. Best wishes!
Download the Binguru Strategy

To leave a comment, you must register or log in to your account.