
Binary options indicator Jurik Volatility Bands generates trading signals based on the assessment of market volatility and price movement. It is perfect for intraday trading and scalping. At the same time, it can be used to trade both on the trend and to make counter-trend transactions to return to the average values of the trading range.
This is a free indicator, which is undoubtedly a plus for those who are taking their first steps in binary options trading. Its signals are not redrawn and are interpreted unambiguously. Of course, Jurik Volatility Bands has its own application features, which we will consider in detail in this review. We will tell you in detail about its operating modes and choose the most effective one. Read on to learn all this and more.
Content:
- Characteristics;
- Installation;
- Overview and Settings;
- Trading Rules for Jurik Volatility Bands;
- Specifics of Application;
- Conclusion;
- Download Jurik Volatility Bands.
Characteristics of the Indicator for Binary Options Jurik Volatility Bands
- Terminal: MetaTrader 4
- Timeframe: M5
- Expiration: 3 candles
- Option Types: Call/Put
- Indicators: jurik-volatility-bands.ex4
- Trading instruments: currency pairs , commodities, cryptocurrencies , stocks
- Trading hours: 8:00 - 20:00 Moscow time
- Recommended brokers: Quotex , Pocket Option , Alpari , Binarium
Installing the Jurik Volatility Bands Binary Options Indicator
The Jurik Volatility Bands indicator is installed as standard in the MetaTrader 4 platform. To do this, you need to add it to the root folder of the terminal by selecting “File” in MT4 and then “Open data directory”. In the opened directory, you need to go to the "MQL4" folder and then to “Indicators”, then move all the files there. Templates are installed in the same way, but are placed in the “templates” folder. You can read the installation instructions in more detail in our video:
Review and Settings of the Indicator for Binary Options Jurik Volatility Bands
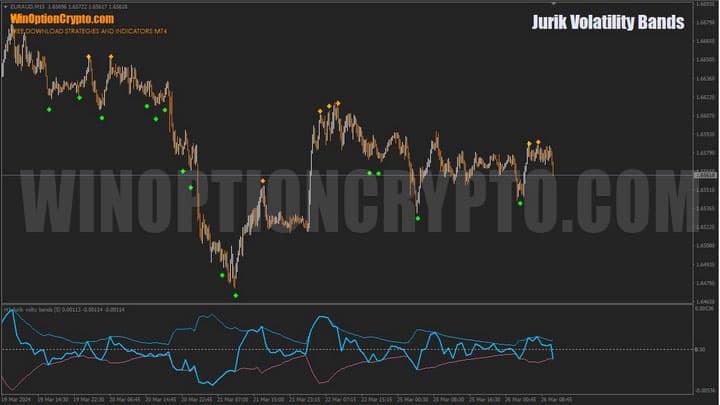
The Jurik Volatility Bands binary options indicator is a “basement” oscillator located at the bottom of the chart. It was developed by the renowned price forecasting specialist and founder of Jurik Research Mark Jurik. For over 10 years, this company has been developing trading strategies and technical indicators for financial markets.
As the name suggests, Jurik Volatility Bands consists of “bands” very similar to Bollinger Bands and the oscillator itself, which generates trading signals when entering or exiting overbought and oversold zones. These bands frame the price, limiting its movement in one direction or another.
Let's note right away that this oscillator is very multitasking and can work in different modes:
- Crossing the zero mark
- Crossing the midline
- Entrance to the zone
- Exit from the zone
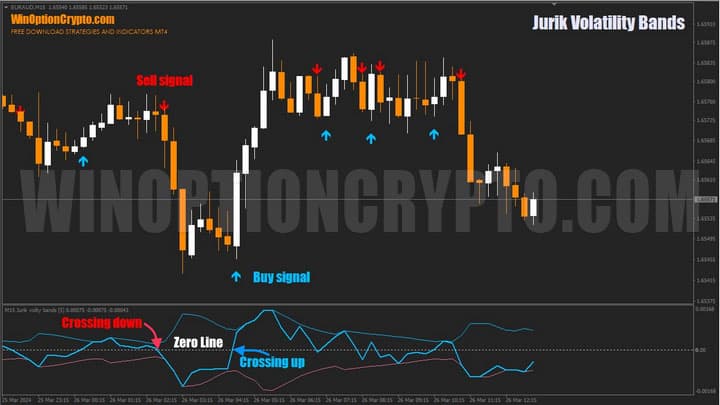
Crossing the Zero Mark
In this mode, the oscillator gives signals when crossing the zero line. As soon as the Jurik Volatility Bands value becomes greater than 0 (crosses the “0” mark from bottom to top), a blue arrow appears under the candlestick, signaling purchases. Similarly, the indicator gives signals to sell - when the indicator crosses the zero mark from top to bottom, a red arrow appears above the candlestick.
Crossing the Midline
In this variant, signals to open trades are received in case of crossing of the middle line between the upper and lower border of the Jurik indicator by the oscillator. Those who use Bollinger bands in their trading will be very familiar with this mode.
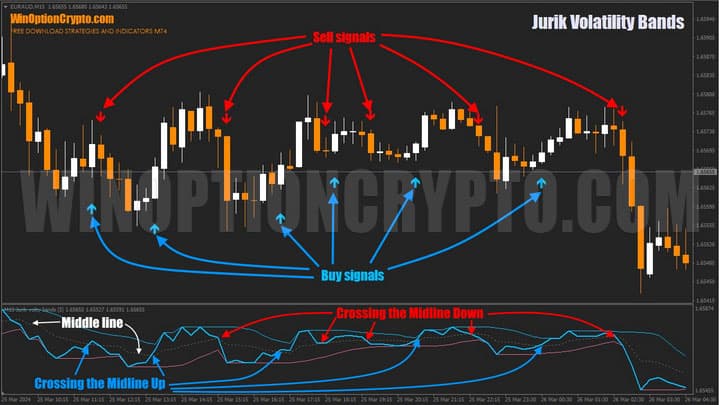
When the oscillator crosses the middle line from bottom to top, a buy signal appears, indicated by a blue arrow under the candle. In the case of a top-down cross, a sell signal appears, in the form of a red arrow above the candle.
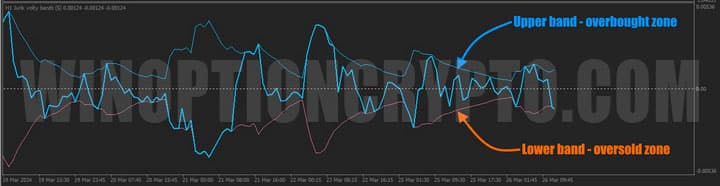
Entrance to the Zone
With this setting, Jurik Volatility Bands will give signals to open positions when the “basement” oscillator touches one of the indicator borders. Touching the upper border means buying, touching the lower border means selling. This mode will be familiar to those who have used the Bollinger Bands and RSI strategy. Let's see how it works on a real example.
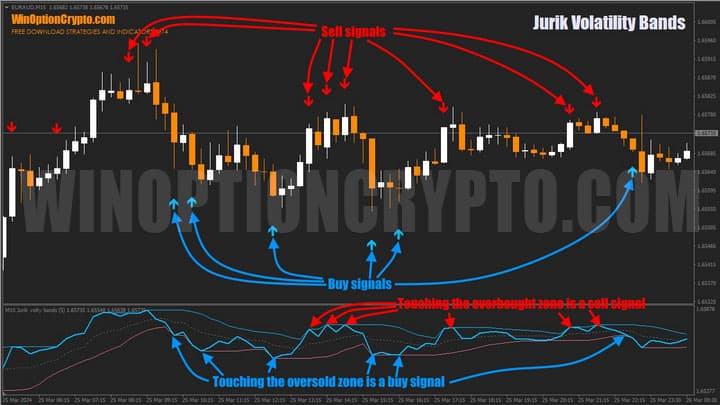
As you can see in the screenshot above, buy signals are received when the oscillator touches the lower line (pale purple), which means the indicator is entering the oversold zone. Conversely, sell signals are received when the oscillator touches the upper blue line, which signals entry into the overbought zone.
Exit from the Zone
In this mode, buy and sell positions should be opened when the oscillator leaves the overbought and oversold zone, which visually looks like a rebound from the upper and lower borders of the Jurik indicator.
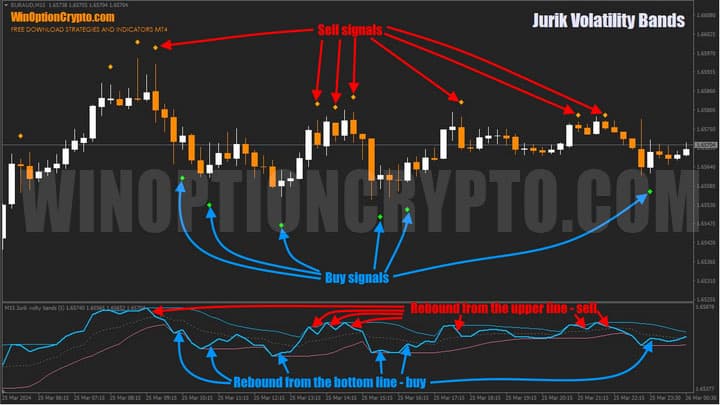
Let us note right away that, in our opinion, this is the most optimal mode of using this technical analysis tool. It gives quite a lot of accurate signals for opening positions, and can be used by both Forex traders and in the binary options market.
The Jurik Volatility Bands indicator has many settings, and all of them are divided into several blocks.
General Settings
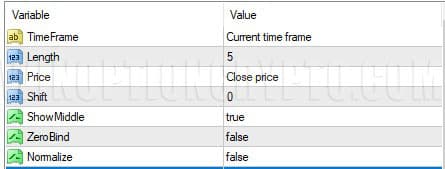
- Time Frame – is responsible for setting the time frame on which the oscillator values are calculated
- Length – indicator calculation period
- Price – select the price type from the list: Close, Open, High, Median, Typical, Weighted
- Shift – shifts the signal by a certain number of bars.
- ShowMiddle – on/off display of the middle line between the oscillator boundaries
- ZeroBind – on/off alignment of indicator values relative to zero
- Normalize – on/off bringing the oscillator to a single scale
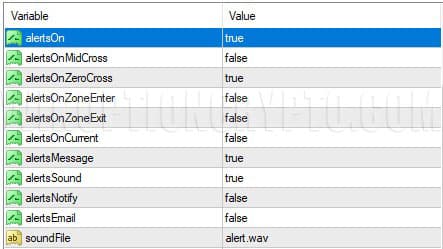
Alerts
This block allows you to customize different messages depending on your needs.
Arrow Settings
Block for setting the appearance of arrows and their position on the chart.
![]()
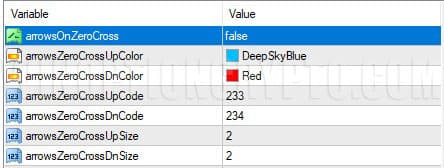
Zero Line Crossing Mode Parameters
ArowsOnZeroCross – on/off this mode. The other settings of this block are responsible for the color of the buy and sell arrows, their appearance and size.
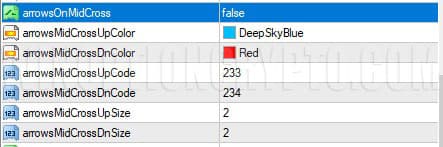
Parameters of the “Crossing the Center Line” Mode
It has similar settings with the only difference being that signals occur when the indicator's middle line is crossed.
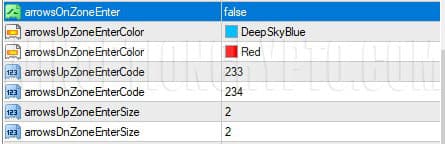
“Enter Zone” Mode Parameters
Signals according to the settings of this block are received in the event that the oscillator touches one of the outer bands of the Jurik indicator.
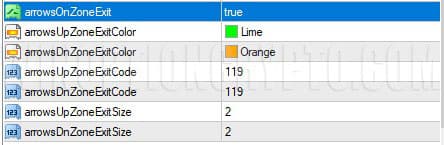
“Exit Zone” Mode Parameters
In this mode, buy and sell signals are received when the “basement” oscillator bounces off the outer bands.
Trading Rules for Binary Options Indicator Jurik Volatility Bands
The Jurik Volatility Bands binary options indicator has extensive functionality. Its four operating modes provide traders with ample opportunities to identify trading signals. For example, it can be used as a tool to confirm graphical analysis. Find out more about how to correctly apply this type of technical analysis in binary options trading from our selection:
- Graphical analysis of binary options
- How to Trade Chart Analysis Figures
- Japanese candlesticks - graphical analysis of charts online
- Live cryptocurrency chart online
- Live chart for binary options free online
In our opinion, the most effective trading method for this instrument is the “Exit from the zone” mode on the current timeframe (M5). Therefore, the rules for opening positions are based on it. We added an exponential moving with a period of 50 to open transactions strictly according to the trend.
Opening a Call Option
- Close price above EMA(50)
- A green dot appeared under the candle
- At the opening of a new candle we buy a Call option
Opening a Put Option
- Close price below EMA(50)
- An orange dot appeared above the candle
- At the opening of a new candle we buy a Put option
It is recommended to select the expiration time of 3 candles. Select the holding period of positions depending on the financial instrument and the results of testing on historical data.
Specifics of Using the Indicator for Binary Options Jurik Volatility Bands
As mentioned above, this tool is very versatile and can be used in different modes, each of which has its own advantages and disadvantages. We will not list all the possibilities of this indicator, leaving space for your own trading ideas. We will only note the possibility of its use with calculations on a higher time frame, for which the “TimeFrame” parameter is provided in its settings. If you substitute “H1” instead of the “Current Time Frame” value, we will get much fewer signals, but they will be more reliable, since they will be calculated on an hourly interval.
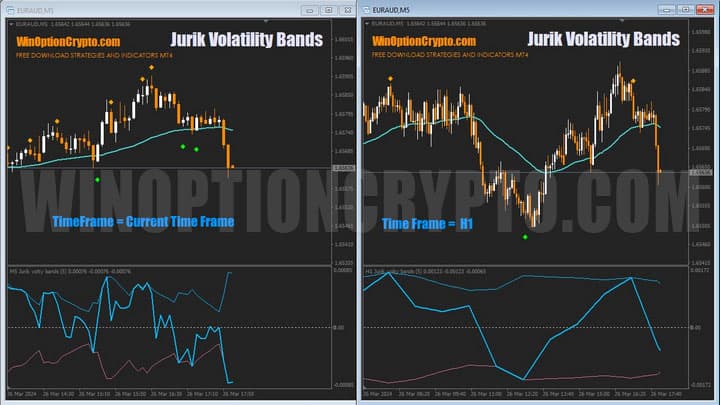
As you can see in the screenshot above, using a higher timeframe as a calculation interval leads to a reduction in the indicator signals. In fact, in the “H1” mode, the Jurik indicator has turned from a scalping tool into a swing trading system, highlighting only significant price extremes on the chart.
Pros of the Jurik Volatility Bands Indicator
Before us is one of the most accurate and non-repainting indicators, which can be used for trading both on the return to the average and on the trend. Its capabilities are especially fully revealed in trading in a flat . Another undoubted advantage is a wide selection of alerts, and the arrows make it convenient for beginners and easy to use.
Disadvantages of the Jurik Volatility Bands Indicator
When scalping against the trend on lower timeframes, it can give too early signals to open a position. Therefore, this trading style is not recommended for beginners. A large number of settings can easily confuse a novice trader and lead to incorrect use of this tool. To avoid this, use the template that you will find in the download archive for this indicator at the end of this article.
Conclusion
The Jurik Volatility Bands binary options indicator is an effective technical analysis tool that generates many profitable signals. Due to its ability to assess the volatility of financial instruments and track price movements, it is great for intraday trading and scalping. Due to the variety of operating modes, it provides ample opportunities for identifying entry points, including counter-trend trades and trend trading.
To fully unlock the potential of the Jurik Volatility Bands binary options indicator, combine it with trend indicators . This will reduce the likelihood of false signals and increase the accuracy of trading. When used correctly, this tool will help increase profits and achieve success in the market. It is recommended to start with a demo account with reliable brokers , observing the rules of risk and capital management. You should start trading on a real account only after achieving stable results on virtual money. We wish everyone successful trading!
Download Binary Options Indicator Jurik Volatility Bands

To leave a comment, you must register or log in to your account.