
In this review, we'll explore one of the most reliable technical analysis tools for binary options trading. It helps traders easily identify bullish and bearish trends, as well as flat markets. You'll also master key strategies for trading within and outside price channels, gaining practical skills useful for both beginner and experienced binary options traders.
Content:
- What are price channels and how are they formed?
- Benefits of Using Price Channels in Binary Options Trading
- Types of price channels
- Construction and definition of price channels
- Methods of trading using a price channel
- Conclusion
What are Price Channels and How are They Formed?
The simplest way to visualize a price channel is as a corridor within which the asset's price moves. Visually, it is bounded by two parallel lines. The lower boundary acts as a support line — a sort of floor from which the price bounces upward. The upper boundary of the channel is a resistance line, acting as a ceiling and limiting price growth from above. In most cases, price fluctuates between these levels, creating a predictable structure that traders can work with.
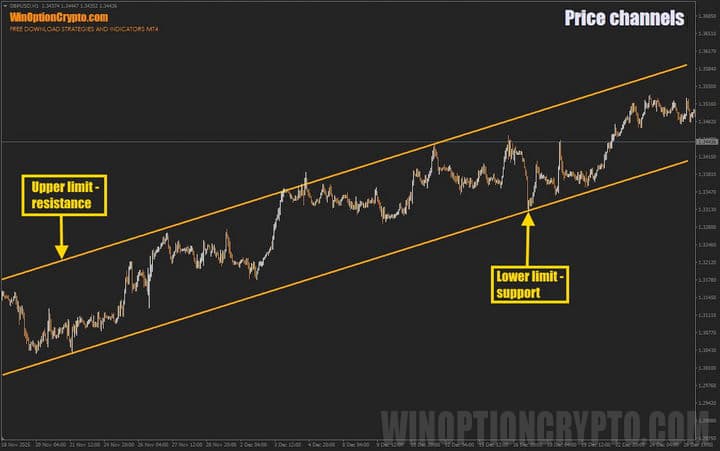
The formation of a price channel is directly linked to support and resistance levels, which reflect market sentiment. A support line is drawn across significant lows. At these points, buying pressure exceeds selling pressure, causing the price to reverse upward. A resistance line, on the other hand, is drawn across significant highs. Here, buying power weakens, and sellers take over, preventing the price from continuing to rise. When support and resistance lines are parallel, they form a price channel.
If you see such a channel on an asset's chart, it signals a temporary balance between supply and demand. Binary options traders, observing these boundaries, often expect the price to continue moving within the range and place trades accordingly. This expectation enhances the channel's significance, as many market participants are simultaneously buying at support and selling at resistance.
Benefits of Using Price Channels in Binary Options Trading
The main advantage of price channels is their clarity and simplicity. When plotted on a chart, market chaos is transformed into a clear structure of price movements, allowing binary options traders to quickly assess the current market situation. Instead of analyzing individual candlesticks and patterns, traders see the overall picture—the direction of the trend and its relative strength, determined by the channel's width and slope.
This visual element on the chart allows you to make quick trading decisions, which is especially important in binary options, where expiration times are often limited to just a few minutes.
These channels provide traders with objective entry points: their boundaries act as natural levels from which the price is highly likely to rebound. When prices approach the lower boundary of an ascending or horizontal channel, this is a favorable moment to buy a call option. Conversely, reaching the upper boundary signals the purchase of a put option. By trading this way, traders follow a structured approach, significantly increasing the probability of consistent results.
Another important advantage of price channels is their versatility. They don't limit traders to a single market scenario. They can be used to trade in flat markets, opening trades from the channel boundaries into the range, as well as to target breakouts during a strong trend or when a reversal is forming. Thus, price channels allow you to prepare a trading plan in advance for both calm and volatile markets.
Types of Price Channels
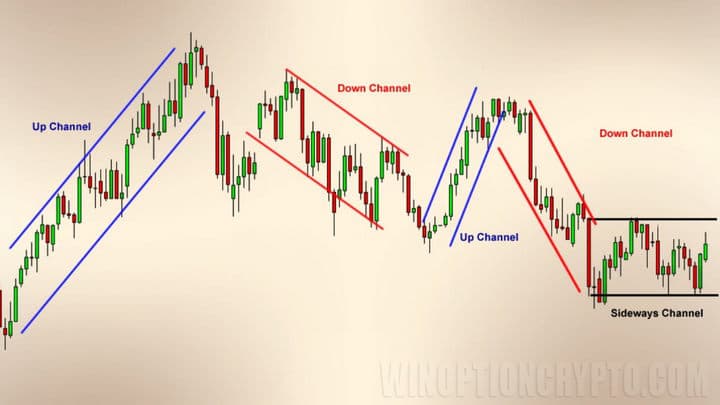
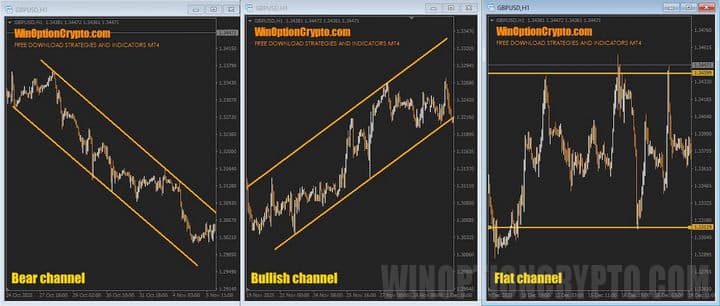
Depending on the trend direction, price channels are divided into ascending, descending, and sideways (flat). In an ascending channel, highs and lows consistently rise, indicating a bullish trend. A descending channel, on the other hand, forms with declining highs and lows, reflecting a bearish trend. A flat channel is characterized by price movement in a horizontal range with no clear direction. This market condition often precedes a strong directional move.
However, it's important to remember that no price channel lasts forever. Sooner or later, the price will break through it, overcoming the support or resistance level. This is especially important, as it can indicate either a strengthening of the current trend or a reversal.
Construction and Definition of Price Channels
Price channels can be drawn on a chart manually or using specialized indicators. In this review, we'll look at the manual method as the simplest and most intuitive. To form an ascending price channel, a trader needs to find two consecutively higher lows on the chart and connect them with a straight line.
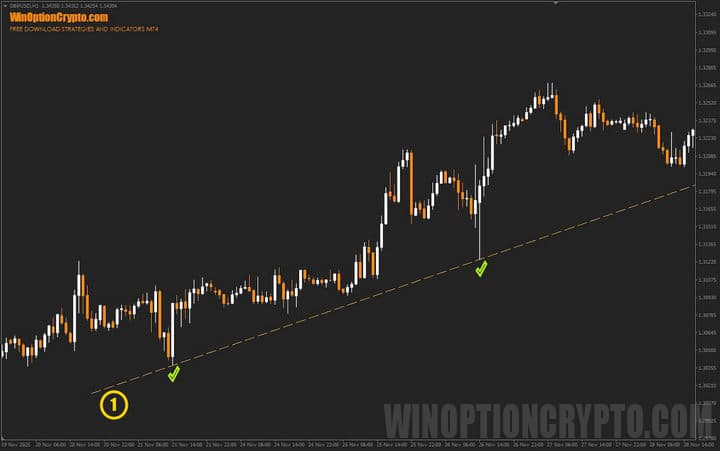
In the image above, this line is marked with the number 1 and acts as support. A straight line is then drawn between these two points, aligned with the highest price points and drawn parallel to the support line.
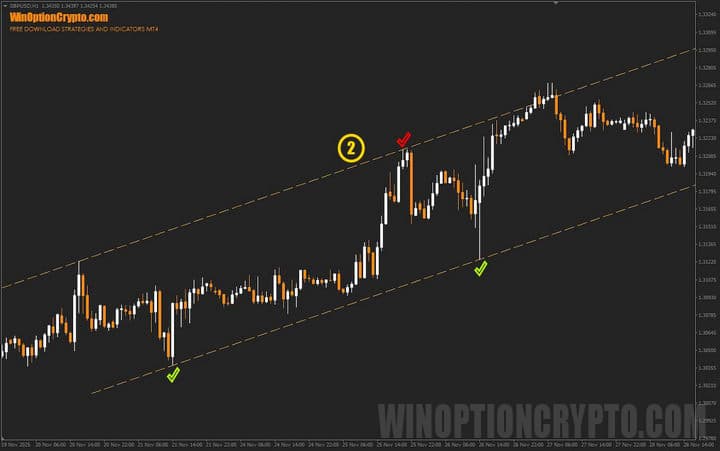
In the image above, it is marked with the number 2 and acts as resistance. For a downward price channel, the process of drawing lines is mirrored.
It's important to keep in mind that trading performance depends largely on the accuracy of defining and drawing channel boundaries. Avoid attempting to draw a channel where a channel doesn't exist. If the boundaries are poorly visible and unclear, the price is likely moving outside a stable range. It's also recommended to pay attention to the number of times the price touches the channel boundaries. The more often the price tests and bounces off support and resistance lines, the more reliable the channel is considered.
Many traders wonder what exactly to connect when drawing channels: candlestick wicks or candle bodies. In practice, both approaches are acceptable. The main thing is to choose one and consistently adhere to it in trading.
Methods of Trading Using a Price Channel
Binary options trading using channels is based on two fundamental approaches:
- Rebound trading;
- Breakout trading.
The choice between these two approaches largely depends on whether the trader believes in the continuation of the current market trend within the channel or expects it to end and a new price movement to begin.
Channel Rebound Strategy
Beginners are recommended to start with the rebound trading strategy, as it is the simplest and most intuitive. This strategy is based on the assumption that the price, upon reaching one of the channel boundaries, will reverse in the opposite direction.
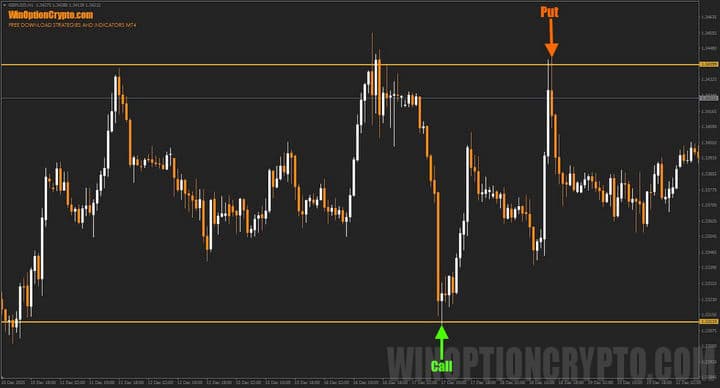
Touching the lower channel boundary triggers a trading signal to buy a Call option. In this case, the trader expects the support level to hold and the price to rise. Conversely, touching the upper boundary triggers a signal to buy a Put option, as a downward rebound is expected.
To increase the reliability of such signals, it is recommended to use additional technical analysis tools, such as RSI or Stochastic oscillators.
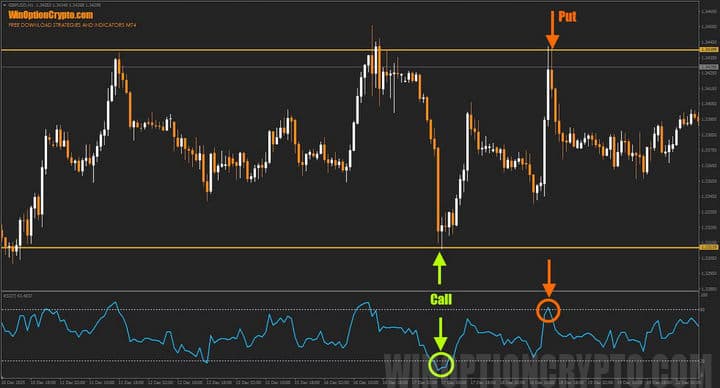
In this case, it's advisable to trigger signals to buy Call options when the oscillator is in the oversold zone below 20, and signals to buy Put options when the oscillator enters the overbought zone above 80. Candlestick patterns, which we discussed in the article "Japanese Candlesticks: Online Graphic Analysis," can be used as additional confirmation.
Channel Breakout Strategy
The breakout trading strategy is the complete opposite of the previous one and is aimed at profiting when the price channel ceases to exist. The breakout itself occurs when the price confidently breaks through one of the channel's boundaries and consolidates beyond it. This typically serves as a signal for a new trend to form.
Thus, when the upper channel boundary (resistance line) is clearly broken, traders buy Call options (Higher), anticipating further price growth. If the price breaks the lower boundary (support line), this becomes a signal to buy Put options (Lower), anticipating continued decline.
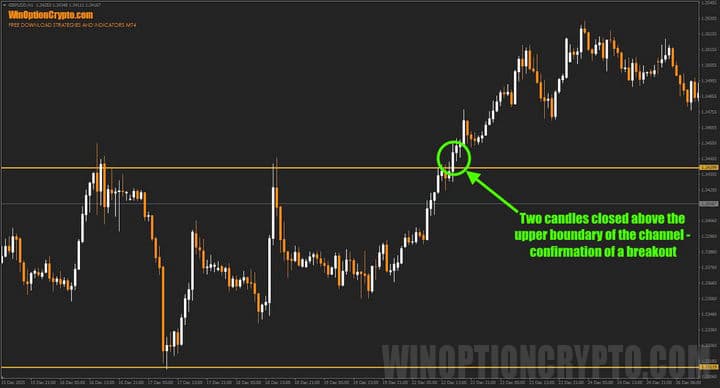
The main drawback of this strategy is the risk of a false breakout, when the price briefly breaks out of the channel and then reverts, resulting in losses. To reduce the likelihood of this, experienced traders recommend waiting for confirmation rather than entering a trade immediately upon the price crossing the channel boundary.
The most reliable confirmation is considered to be the closing of several candles outside the channel. Another method of confirmation is a retest — the moment when the price, after a breakout, returns to the channel boundary, testing it from the opposite side. In this case, the former resistance becomes support, after which the price rebounds in the direction of the breakout.
Conclusion
Overall, price channels are one of the simplest yet most reliable graphical tools in binary options trading. They allow for a clear view of market structure and offer two main channel strategies suitable for both conservative and more aggressive traders. However, it's important to remember that their success depends not only on the ability to correctly construct a channel on an asset's chart, but also on discipline and patience while waiting for a quality trading signal confirmed by technical indicators. Mastering these methods, combined with sound money management and practice on a demo account with a reliable binary options broker, increases trading stability and profitability.

To leave a comment, you must register or log in to your account.