
The Pocket Option "Vortex" binary options strategy is based on a combination of two popular technical analysis indicators. With these indicators, traders can not only identify the start of a new trend early but also confirm the direction of an existing one. This method is ideal for active binary options trading, as it effectively filters out market noise and helps focus on strong price movements. In this review, we'll explain how to correctly use this system's signals to achieve maximum results.
Content:
- Characteristics
- Installation
- Overview and settings
- Trading Rules for the Pocket Option "Vortex" Strategy
- Specifics of application
- Conclusion
Characteristics of the Pocket Option Strategy for Binary Options
- Terminal: Webtrader Pocket Option
- Timeframe: M5
- Expiration: 2 candles
- Option Types: Call/Put
- Built-in indicators: Vortex (5), EMA (21)
- Trading instruments: currency pairs , commodities, cryptocurrencies , stocks
- Trading hours: 8:00 - 20:00 (GMT+2)
- Recommended brokers: Pocket Option
Installing the Pocket Option "Vortex" Strategy for Binary Options
The Pocket Option "Vortex" strategy indicators are installed in the standard manner. To add them to the chart, open the main trading platform window, click the "Indicators" icon, and go to the indicator selection menu. From the list that appears, select the desired instrument and configure its parameters.
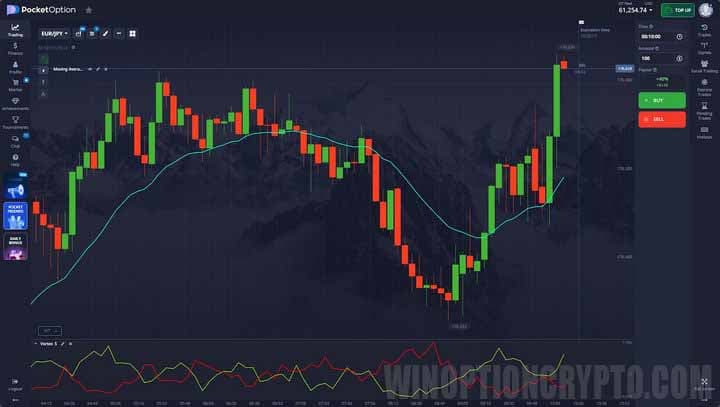
Pocket Option "Vortex" Binary Options Strategy Review and Settings
The basis of this trading system is the Vortex indicator, whose name translates from English as "whirlwind." It is a relatively new technical analysis tool designed to identify the beginning of a new trend and confirm its current direction.
The story of its origin is remarkable in that two traders, Etienne Botes and Douglas Sipman, decided to test the ideas of Austrian inventor Viktor Schauberger, who had studied vortex flows in water. They hypothesized that similar cyclical movements could be observed in financial markets.
Furthermore, the development of the Vortex indicator was influenced by the concept of "Directional Movement" by Welles Wilder, the creator of the well-known ADX and RSI tools. This indicator first became known in January 2010, when it was published in the journal Technical Analysis of Stocks & Commodities.
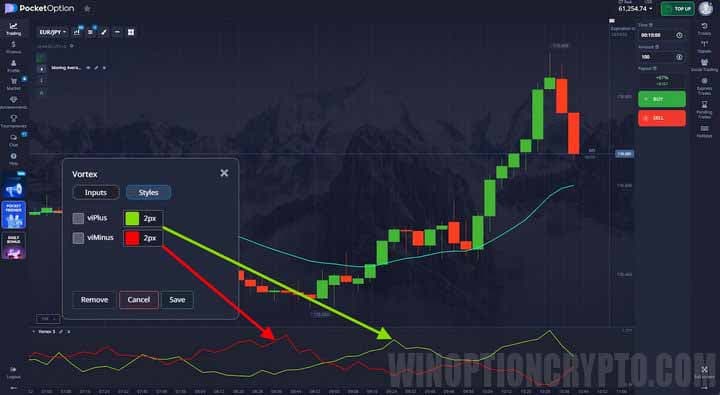
The indicator itself consists of two intersecting lines located below the price chart:
- viPlus – a positive vortex that measures upward price movement;
- viMinus is a negative vortex that measures downward price movement.
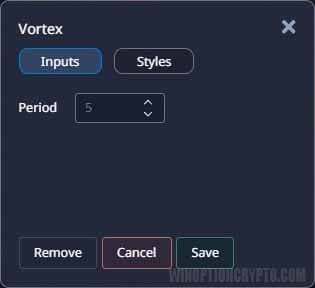
You can specify the calculation period in the indicator settings. By default, it's 14, but for binary options trading on a five-minute timeframe, a value of 5 is considered optimal.
The indicator signals are formed at the moment of intersection of its lines.
If the green viPlus line crosses the red viMinus line from bottom to top, it's a signal to buy a Call option or open a long position on Forex . A reverse crossover triggers a sell signal for Forex, and a buy signal for a Put option for binary options.
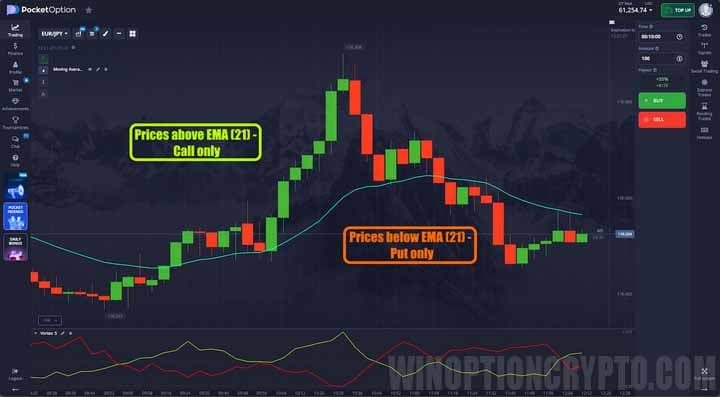
However, despite its obvious advantages, the Vortex indicator sometimes generates false signals. To reduce their impact and improve trading accuracy, an additional filter has been added to the strategy – an exponential moving average (EMA) with a period of 21. According to the system's rules, Call trades are opened only when candles close above the EMA(21), and Put options are opened only when candles close below this line.
Setting up a moving average is very simple. Traders can set the calculation period, choose its type—simple, exponential, weighted, or smoothed—and customize the line color and thickness.

Trading Rules for the Pocket Option "Vortex" Strategy
First, you need to determine the direction of the current trend by observing the position of the candles relative to the exponential moving average. If the candles close above the EMA (21), the market is bullish; if they close below, it's bearish.
Then we check the Vortex indicator readings: the green line should be above the red line in an uptrend and below it in a downtrend.
When both conditions are met, wait for a signal pattern to appear: the last candle must close above the previous candle's high to open a Call option and below the previous candle's low to open a Put option.
If you're interested in learning how candlestick patterns are formed and how to use them to their maximum advantage in binary options trading, we recommend reading this collection of articles on this topic:
- Candlestick analysis and binary options .
- Japanese Candlesticks for Beginners and How to Read Them .
- Japanese candlesticks – graphical analysis .
- Using Pin Bars in Binary Options Trading .
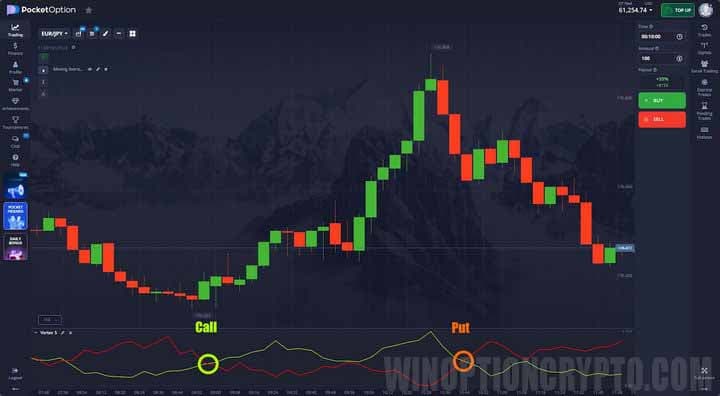
Opening a Call Option
- Prices are above EMA (21) – the market is in a bullish trend.
- The green line viPlus is above the red line viMinus.
- The last candle closed above the previous one's high.
- At the opening of a new candle, we buy a Call option.
Opening a Put Option
- Prices below EMA (21) – the market is in a bearish trend.
- The red line viMinus is above the green line viPlus.
- The last candle closed below the previous one's low.
- At the opening of a new candle, we buy a Put option.
The expiration time should be set to two candles. However, you can experiment with other periods.
Specifics of Using the "Vortex" Binary Options Strategy for Pocket Option
The main indicator of this trading system has several features that should be known before using it in practice. Using Vortex, a trader can not only determine the preferred trading direction but also assess the strength of the trend. This can be done by measuring the distance between the viPlus and viMinus lines: the greater the distance, the stronger and more stable the current trend. If the lines frequently intersect or move almost parallel, the market is flat .
Advantages of the Pocket Option "Vortex" Strategy
The main advantage of this strategy is its early warning of the onset of a new trend. The system's main indicator alerts traders to the emergence of a new price trend much earlier than many classic technical indicators. Furthermore, the system is universal and can be used not only for scalping on short-term timeframes but also for opening medium-term trades.
Cons of the Pocket Option "Vortex" Strategy
The system's drawbacks include false signals during flat trading. During sideways movements, the Vortex lines often intersect, generating false entry points. Increasing the calculation period to reduce the number of such signals can lead to a delay. As a result, the trading signal about the start of a new trend arrives late, and the trader risks missing a significant portion of the move.
Conclusion
The Pocket Option "Vortex" binary options strategy is a successful combination of several time-tested technical analysis tools. Each performs its own function: the Vortex and EMA(21) determine trading direction, confirming each other's signals, while the candlestick pattern indicates the optimal moment to open trades.
Despite its high effectiveness, the strategy's main indicator is considered relatively new and not as reliable as classic RSI , MACD , and Stochastic . Therefore, before trading binary options with real funds using this method, be sure to test it on a demo account with the Pocket Option broker. Remember to manage your risks and capital . Happy trading!
Having trouble understanding how this strategy or indicator works? Let us know in the comments below, and subscribe to our WinOptionCrypto YouTube channel , where we'll be sure to answer all your questions in a video.

To leave a comment, you must register or log in to your account.