
One of the most pressing questions for a beginning binary options trader is when exactly to enter a trade. Charts appear chaotic, indicators contradict each other, and the market seems to be deliberately moving against a newly opened position. If this sounds like you, it's not discipline or luck you're lacking, but a specific tool that will pinpoint where real market activity is concentrated right now. This is precisely what the Heat Map solves.
In this article, we'll explore a trading strategy based on this principle on the Binarium platform, one of the most accessible binary options brokers for Russian-speaking traders. You'll learn how to read trading signals, distinguish strong entries from false ones, and what a trade looks like in practice, using specific examples.
Content:
- What is the advantage of the Heat Map strategy?
- How to Apply the Heat Map Strategy on Binarium
- Conclusion

What Is the Advantage of the Heat Map Strategy?
Most beginners make the same mistake: trying to predict price movements based on their intuition or overloaded charts with dozens of indicators. As a result, signals contradict each other, the decision to open a trade is delayed, and the entry point is missed. The Heat Map strategy solves this problem in a fundamentally different way: rather than predicting market behavior, it shows where buyer and seller activity is currently concentrated. As a result, binary options traders see not abstract lines, but currency pairs that are of interest to major players, transforming analysis from a guess into an informed decision.
Another important advantage is that this strategy is equally suitable for traders of all experience levels. The trade opening algorithm is easy to repeat. There's no need to spend hours studying fundamental analysis or memorizing complex Japanese candlestick patterns. This makes the Heat Map simple and straightforward for those looking to achieve their first consistent results in binary options trading.
How to Apply the Heat Map Strategy on Binarium
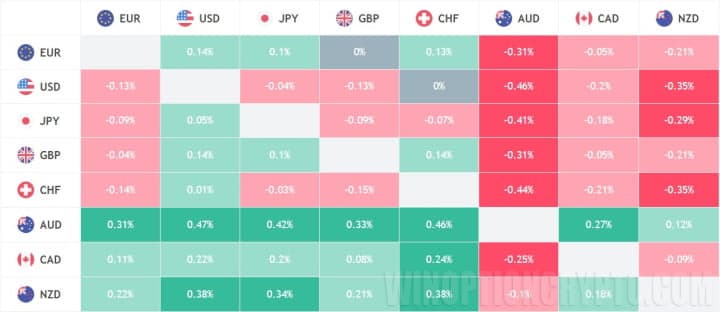
The heat map is a table resembling a chessboard, displaying the relationship between strong and weak assets depending on the selected timeframe and display mode (points or percentages). Currency codes are displayed at the top and sides. The horizontal row indicates the strengthening or weakening of one asset against another. Strengthening of one currency against another is indicated in green, while its weakening is indicated in red. In addition to these two primary colors, other shades are also available:
- pale green – the asset price is approaching the overbought zone;
- pale red – the asset price is approaching the oversold zone;
- Gray – indicates a neutral attitude of traders towards this currency pair.
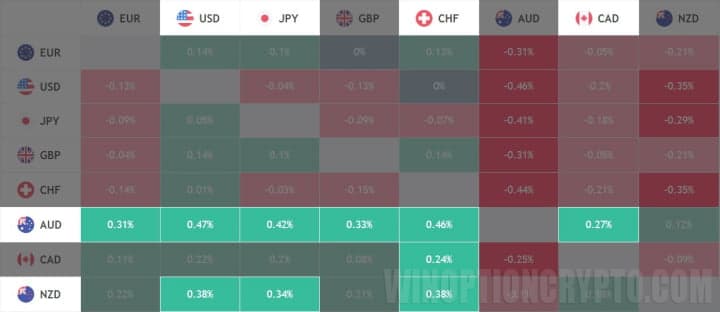
The image above shows that at the moment it is preferable to open a Put option on the following currency pairs: EUR/AUD, AUD/USD, AUD/JPY, GBP/AUD, AUD/CHF, AUD/CAD, NZD/USD, NZD/JPY and NZD/CHF.
The table above shows the assets on which Call options should be opened: EUR/AUD, AUD/USD, AUD/JPY, AUD/CHF, AUD/CAD, NZD/USD, NZD/JPY.
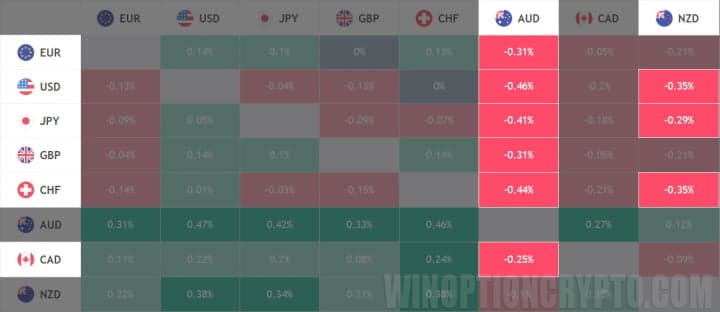
When applying this strategy on the Binarium platform, pay attention to the intersections colored green and red, and ignore the intermediate shades. Trading using the Heat Map should be done with options with expirations of 15–30 minutes, investing no more than 2% of the deposit per trade.
Additionally, to increase the effectiveness of your trading strategy, it is recommended to use additional funds that can be obtained by using promo codes to top up your account.
Conclusion
So, the Binarium "Heat Map" strategy gives the beginning binary options trader what many lack at the start: a clear decision-making system free from unnecessary guesswork and emotion. You no longer stare at the chart in confusion, but see specific currency pairs for which the market is poised to move in a certain direction, and you understand exactly when to open a trade. The strategy described in this article can be applied immediately, without wasting time learning complex theory. The main thing is to start practicing and observe how this method works in real market conditions.
If you'd like to try this strategy in practice, the Binarium platform provides everything you need: a user-friendly terminal with a clear interface and a demo account for practicing the necessary skills risk-free. Register, open a demo account, and test the Heat Map strategy on real charts. Your first positive experience in binary options trading is much closer than you think, and the right strategy and a reliable platform will become your foundation on the path to consistent results.
Having trouble understanding how this strategy or indicator works? Let us know in the comments below, and subscribe to our WinOptionCrypto YouTube channel, where we'll be sure to answer all your questions in a video.
To leave a comment, you must register or log in to your account.