

Timeframes are a key tool in binary options market analysis. They play a crucial role in developing trading strategies, allowing you to visually highlight the trend direction over a given period of time. They also help identify key support and resistance levels and identify chart analysis patterns.
Strictly speaking, a timeframe is the time interval during which a single candlestick appears on a chart. Beginner traders often find it difficult to understand which timeframe to choose and what factors should influence their choice. In this review, Binarium broker experts have analyzed the situation and are ready to share their own findings on binary options trading on different timeframes.
Content:
- Types of Timeframes in Trading: How to Choose the Right Interval (2026)
- Elder's legendary method for filtering out losing trades
- Relationship between timeframe and strategy
- Choosing a timeframe for trading on Binarium
- Conclusion
Types of Timeframes in Trading: How to Choose the Right Interval (2026)
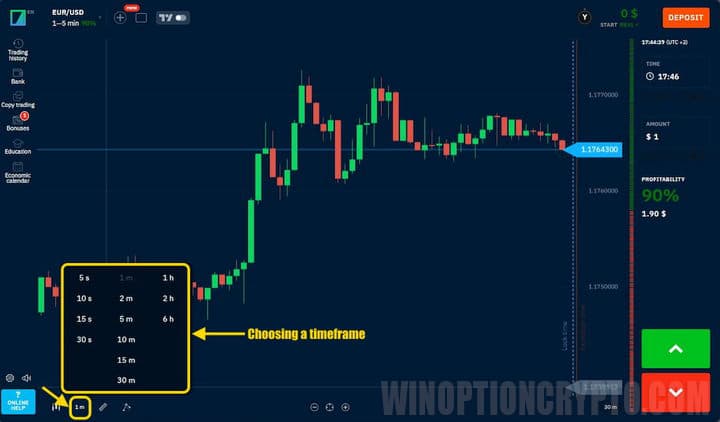
Timeframe settings are configured in the trading terminal window. The most common timeframes that make sense to work with range from one minute to one day:
- Short-term: M1, M30;
- Average: H1, H4;
- Long-term: D1.
A timeframe not only shows the time it takes for a candle or bar to form on a chart, but it's also essential for analyzing price changes over a given period. In addition to standard timeframes, custom timeframes developed by individual brokers to attract traders are also used. These include non-standard two-hour and two-month timeframes.
Short-term timeframes offer more opportunities for profitable trades during calm market conditions. Traders should open trades on short-term timeframes based on technical analysis. According to Binarium experts, this tactic can consistently deliver 80% profit. To choose the optimal timeframe, practice is needed, combining intervals with different strategies and instruments.
Elder's Legendary Method for Filtering Out Losing Trades
Every experienced trader has their own method for using timeframes, but if you're just starting out and don't yet know which timeframe to work with and how to combine it with your tools and strategy, we recommend listening to the advice of experienced investors willing to share their opinions. 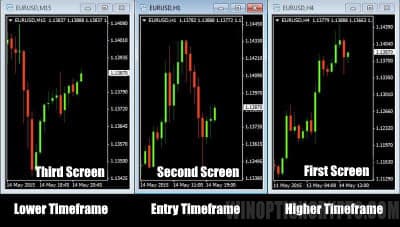
The author of one of the most well-known trading methods is Alexander Elder. You may have heard of Elder's Three Screens strategy, named in his honor. The essence of the method boils down to the simultaneous use of three screens with three timeframes: one primary and two secondary. Elder asserted that decisions can only be made after confirming the forecast for each timeframe.
Should you follow Elder's methodology or develop your own method for combining timeframes and strategies? The decision is yours. The key is to understand that setting the timeframe is one of the most important steps on the path to your goal. Analysis, instrument selection, and strategy selection — all of these yield results only if they are properly combined with the timeframes.
Relationship Between Timeframe and Strategy
So, if time periods are directly related to strategy selection, let's consider the most obvious "working" combinations. Conventionally, in the trading world, there are four categories of strategies:
- technical;
- indicator;
- fundamental;
- based on candlestick analysis.
The technical category includes strategies based on technical analysis. Price levels, support, and resistance lines serve as auxiliary tools for the trader. Almost all timeframes work with these strategies, but the hourly timeframe is considered the most effective.
Indicator-based strategies involve the use of technical indicators. Almost all timeframes are acceptable here, but the choice will depend on the entry parameters.
Fundamental strategies are the most practical and thorough, relying on in-depth fundamental analysis. For currency pairs, one of the most widely used assets, timeframes of M5 and M15 are ideal. For stocks, longer timeframes are used — from a week to a month.
The Price Action figure and candlestick pattern analysis strategy works great in conjunction with H4.
Choosing a Timeframe for Trading on Binarium
It would be unfair to deprive you of choice or insist on using specific intervals. Binarium experts recommend gaining practical experience through trial and error. This is the path to professionalism  growth and knowledge based on personal practice. Furthermore, there is no consensus regarding the use of any particular timeframe.
Analyze the information described above, try different options, and note the most successful and losing ones. To avoid taking unnecessary risks, practice and test strategies on a demo account.
Of the most commonly used timeframes on our website, we'd like to highlight M1 and H1. Among all the others, they work especially well in combination with basic trading strategies and indicators. Moreover, working with these timeframes doesn't require candlestick patterns, chart figures, or the economic calendar. Technical analysis is perfectly capable of unlocking the potential of such combinations and ultimately ensuring profit.
Conclusion
So, we've covered the main types of timeframes that are actively used in binary options trading on the Binarium platform. We recommend choosing the timeframe on which your strategy's indicators generate a high percentage of profitable trades. Keep in mind, however, that this optimal timeframe will likely vary depending on the selected asset and the strategy itself. Even within a single financial instrument and trading method, it's a good idea to experiment with other timeframes, especially when your method's effectiveness begins to decline.
Remember: only practice can help you choose the optimal timeframe. So don't be afraid to experiment on a demo account, practicing different timeframe combinations in binary options trading.

To leave a comment, you must register or log in to your account.